Signals What-if Analysis
Region availability: Melbourne
Introduction
This app allows you to predict changes in the speed, volume, hazard, and congestion of each Link when you change the intersection cycle time and green percentage.
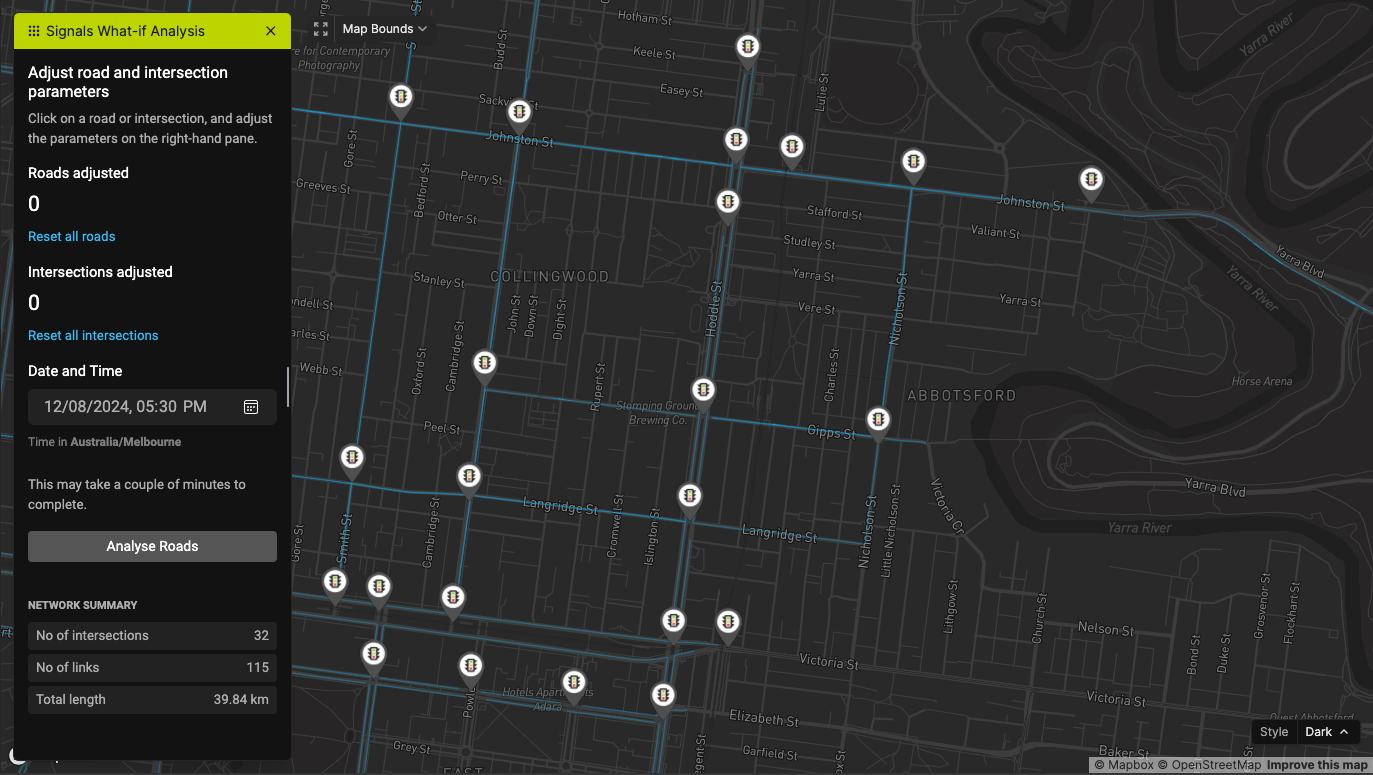
Step 1 - Adjust the links
You can adjust the green light percentage by clicking on each Link. You can also adjust the cycle time by clicking on each Intersection.
Use the "Reset" button to change the values back to the original values.
The map will indicate the Links you've changed with a green line color.
Step 2 - Configure the date and time
Use the left pane to adjust the date and time.
Step 3 - Perform the analysis
Once you've configured everything, click on "Analyse Roads" to start the what-if analysis. The process will take 10 to 50 seconds, depending on the size of the network and your configuration.
Step 4 - Analyse the results
You will see this screen once the analysis is done.
Overall stats
This section shows the overall change in volume, speed, hazard, and congestion of all predicted Links. You can use the Bounds Selector tool to draw a polygon, and the stats will only include Links in the polygon.
Time
The map shows the difference plot at a particular time. Since the app predicts 3 hours ahead, use the Time selector to change the time. The plot will change according to this selection.
Component
Use this selector to change the map to visualize volume, speed, hazard, or congestion.