Heatmap
Region availability: All regions
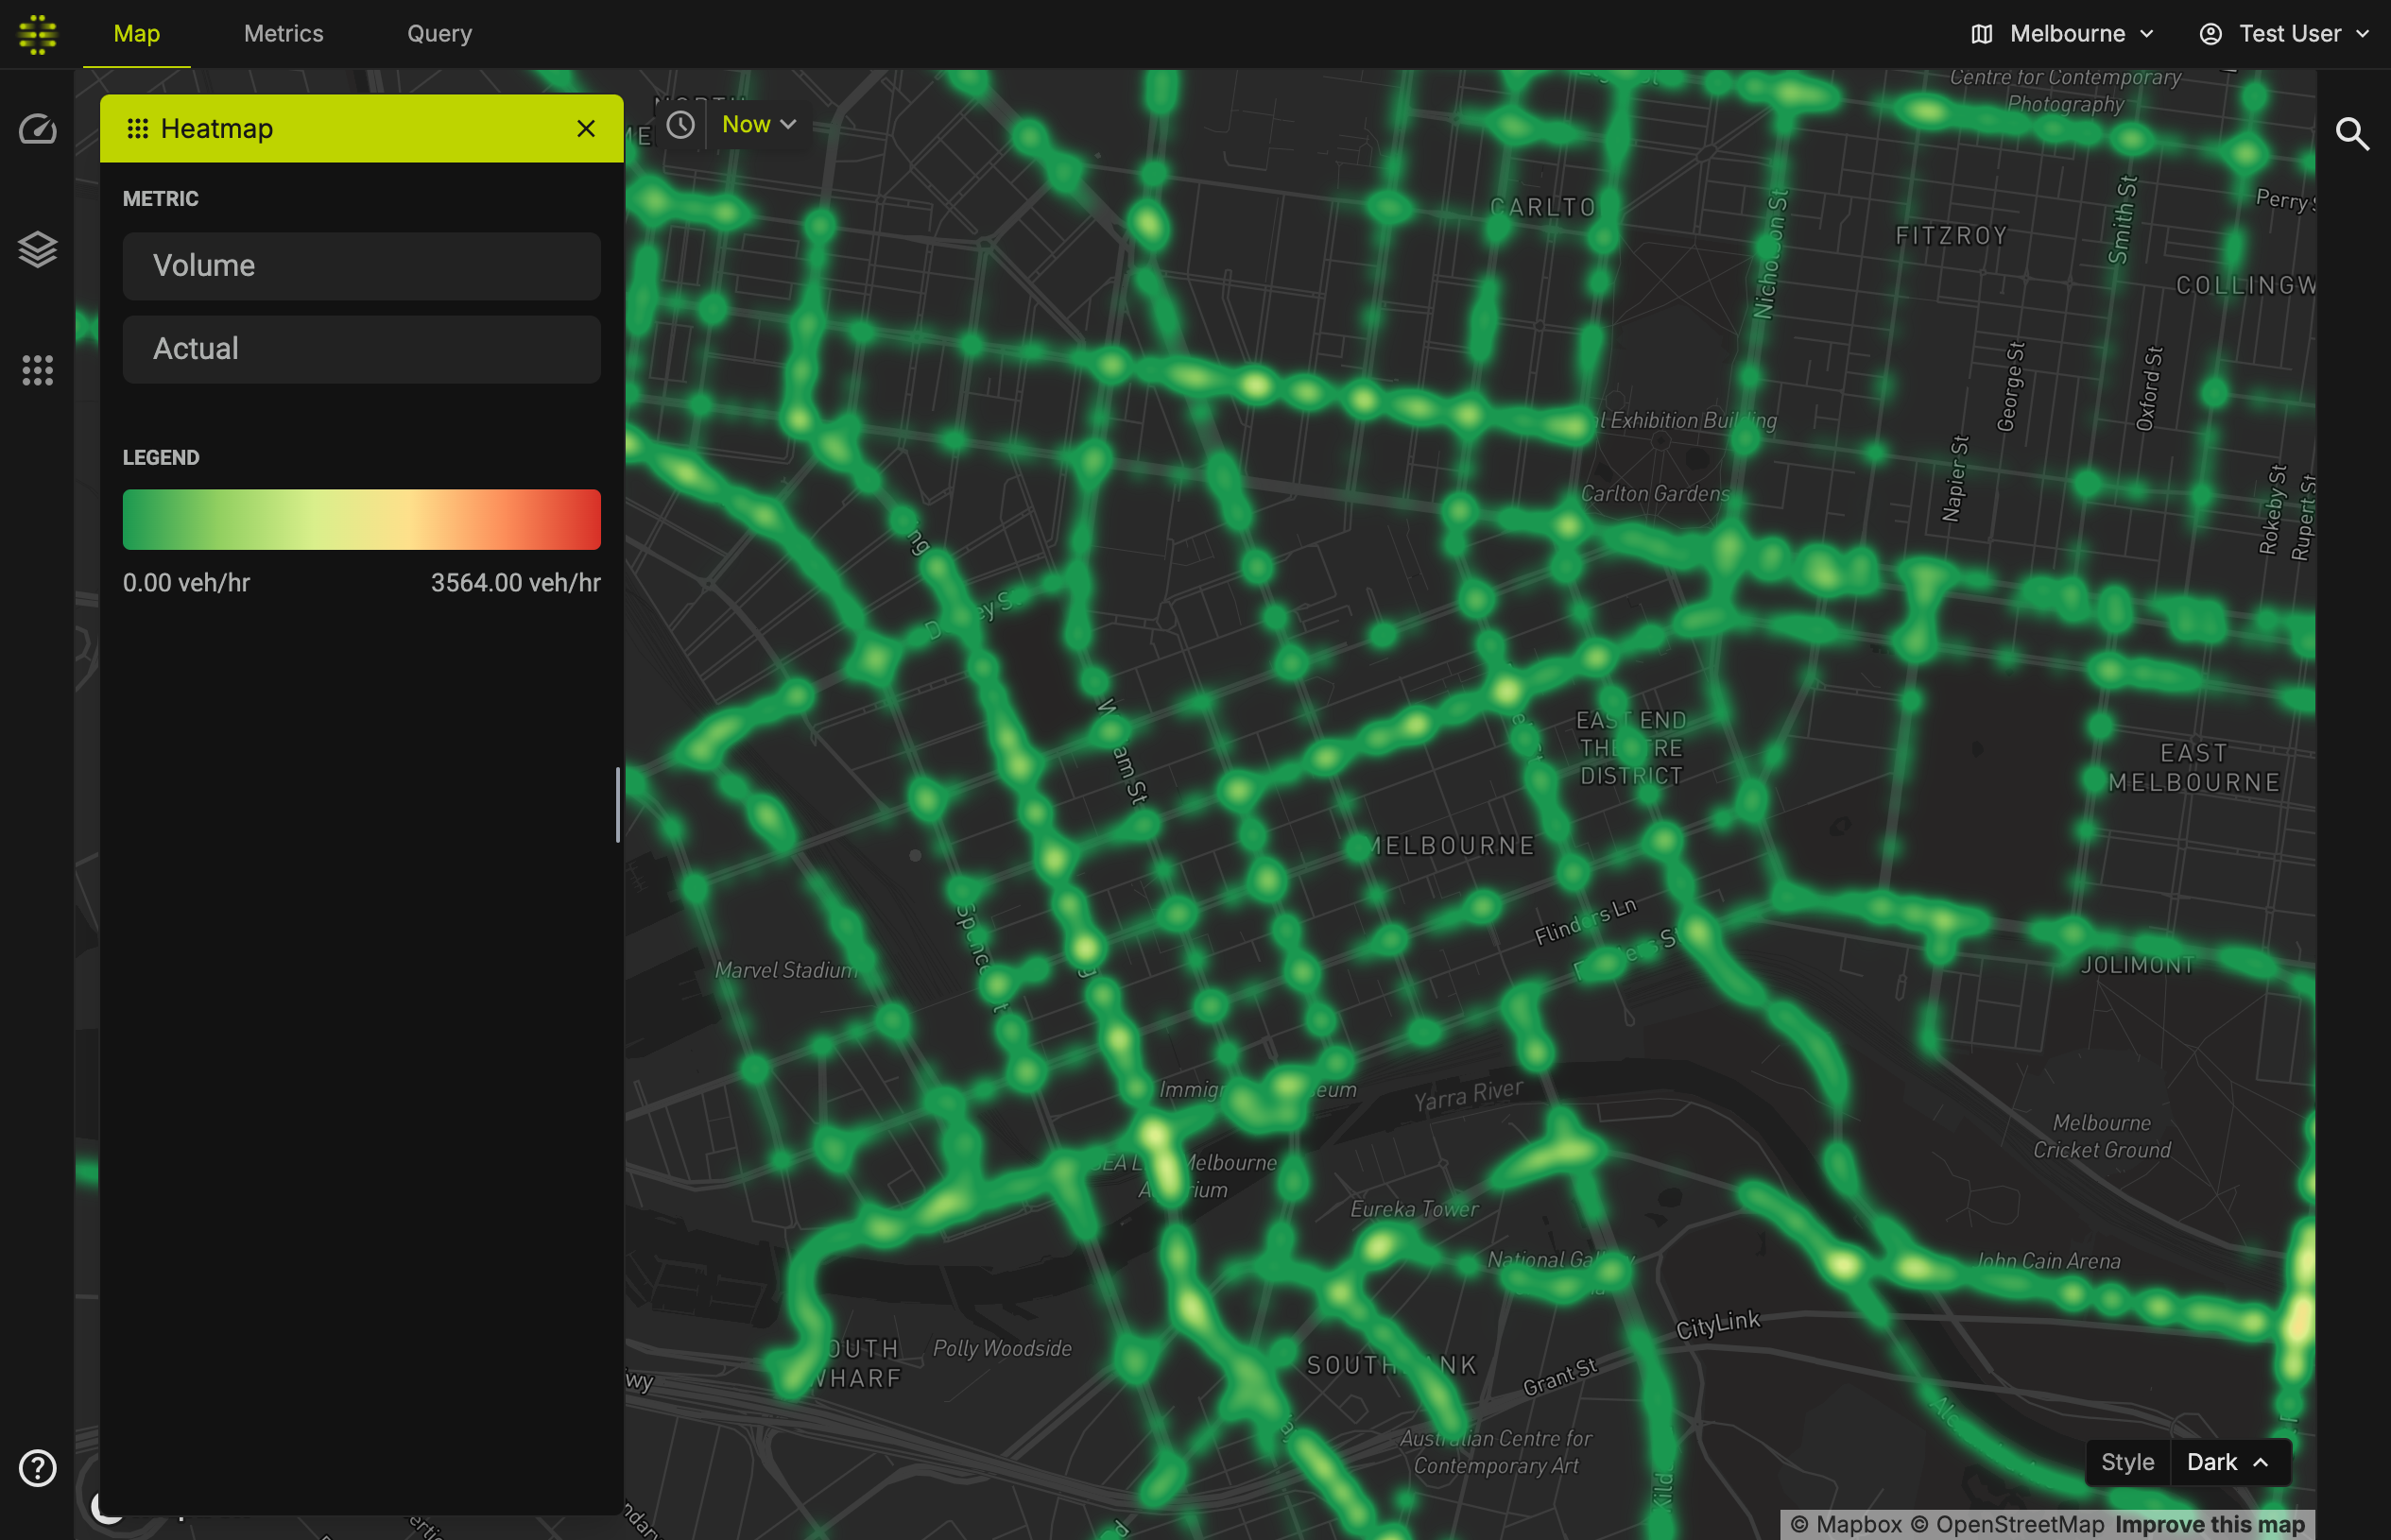
Heatmap allows you to draw a heatmap about the volume, speed, hazard, congestion, or emission of each Link.
Metrics
Use the top select widget to choose which metric to display.
There are five metrics you can choose:
- Volume
- Speed
- Hazard
- Congestion
- Emission (predicted)
Subclass
Each metric might have a different set of subclasses. For example, the "Volume" metric has subclasses that represent 15-minute prediction, up to 180-minute prediction.
Use the bottom select widget to choose the subclass.