Roads What-if Analysis
Region availability: Melbourne, Metropolitan Melbourne
Introduction
This app allows you to predict changes in the speed, volume, hazard, congestion, and emission of each Link when you change the speed limit and number of lanes.
Step 1 - Adjust the links
When you first open the app, you will see the following screen:
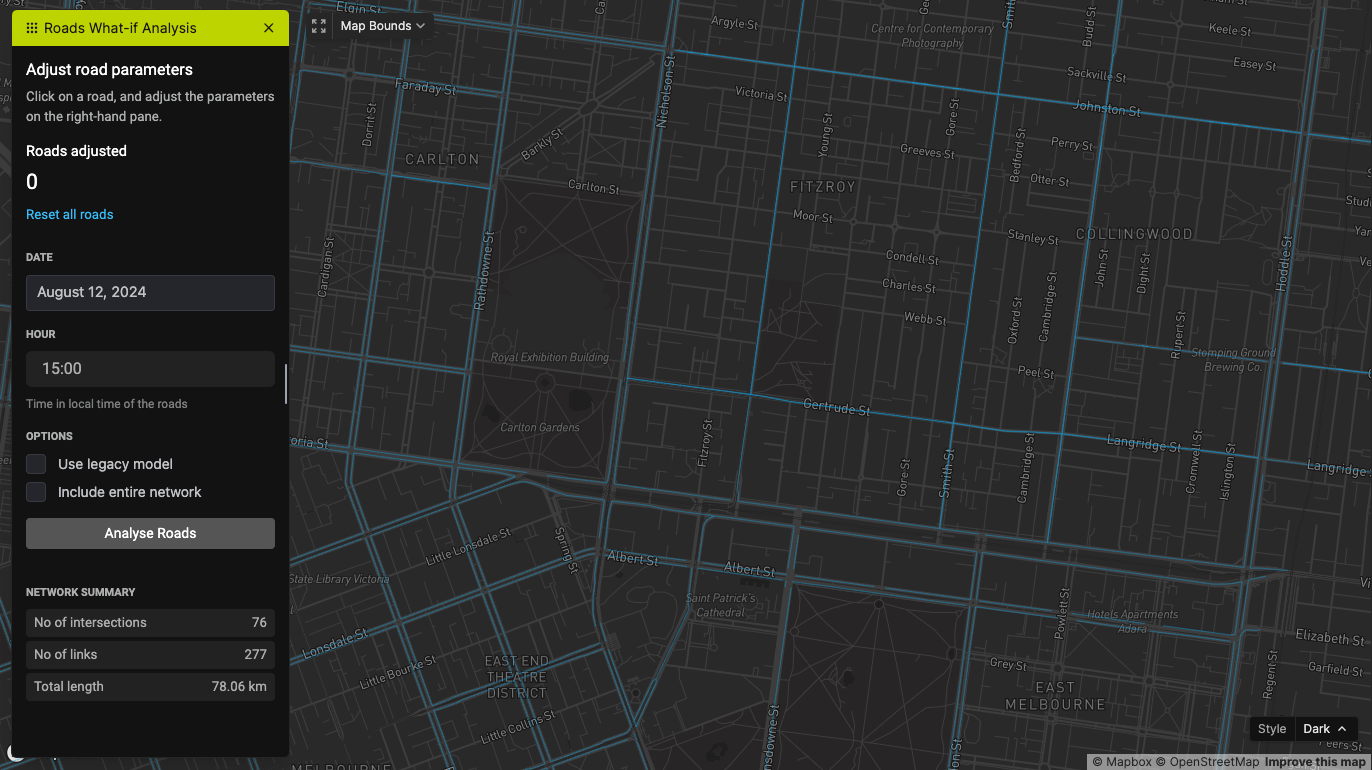
You can adjust the speed limit and number of lanes of each Link by clicking on the Link you want to change. A popup will appear on the top right corner.
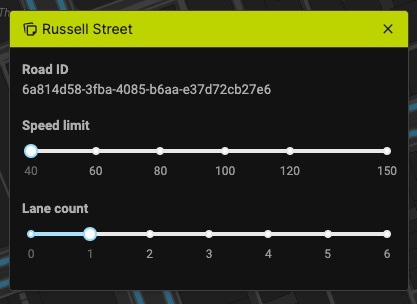
Use the slider to change the speed limit and number of lanes. To close a Link, slide the lane count slider to 0.
Use the "Reset" button to change the values back to the original values.
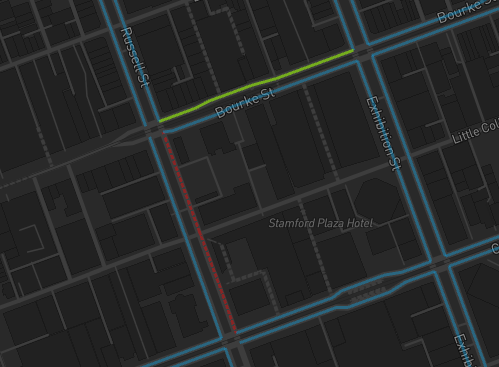
The map will indicate the Links you've changed with a green line color. If you close the Link, it will show as a dashed red line.
Step 2 - Configure the prediction
Use the left pane to adjust the date, time, and prediction options. Currently, you can set a date of up to 6 days ahead.
Options
- Use legacy model - Check this option to use the legacy what-if prediction model for the prediction.
- Include entire network - Check this option to predict the values for all Links in the network. Otherwise, only Links that are near the changed Links that will be predicted. Note that this will take around 30 to 40 seconds to complete.
Step 3 - Perform the analysis
Once you've configured everything, click on "Analyse Roads" to start the what-if analysis. The process will take 10 to 50 seconds, depending on the size of the network and your configuration.
Step 4 - Analyse the results
You will see this screen once the analysis is done.
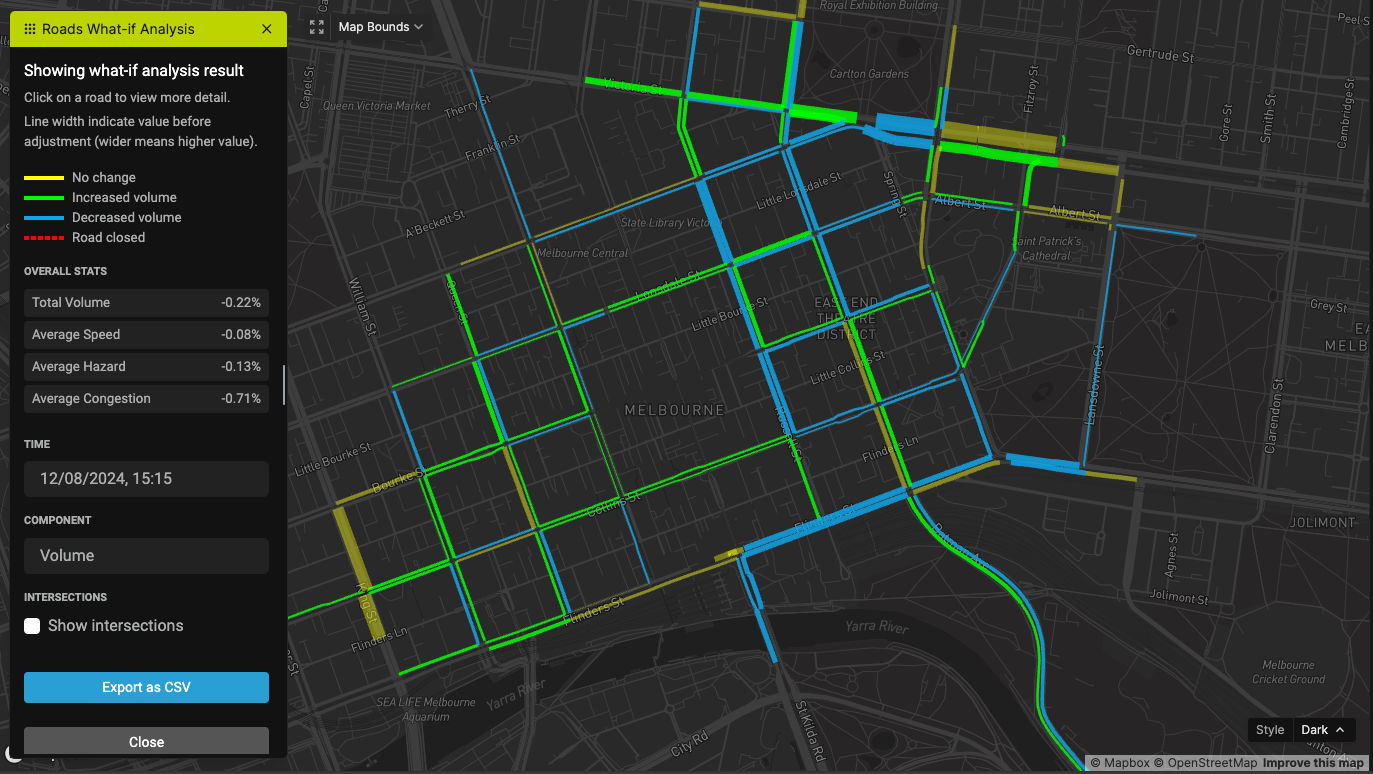
Overall stats
This section shows the overall change in volume, speed, hazard, and congestion of all predicted Links. You can use the Bounds Selector tool to draw a polygon, and the stats will only include Links in the polygon.
Time
The map shows the difference plot at a particular time. Since the app predicts 3 hours ahead, use the Time selector to change the time. The plot will change according to this selection.
Component
Use this selector to change the map to visualize volume, speed, hazard, congestion, or emission.