Traffic Congestion
Region availability: Melbourne, Metropolitan Melbourne
This layer visualises the congestion index of each Link on the map. You can choose to view the actual congestion index (at the selected time), or any volume predictions up to 3 hours ahead.
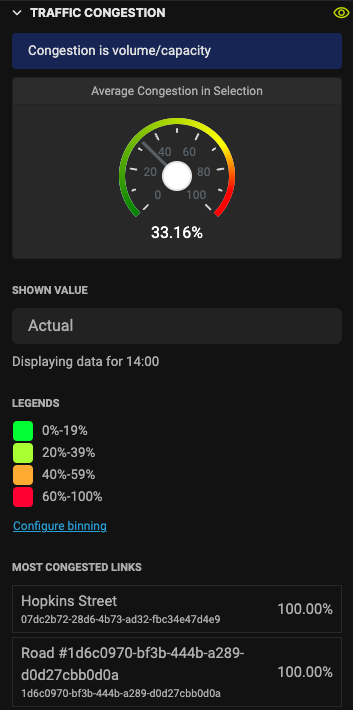
Most congested links
This layer shows the top 10 most congested links within the map selection. You can click on the street name to fly onto the link.
Configure shown value
Use the "Shown Value" selector to select which data you want to see. "Actual" means the actual congestion index shown at the selected time. "15-minute prediction" means the predicted congestion index 15 minutes ahead since the selected time.
Below the selector, there is a text that shows you which time is shown on the map.
When you select a prediction, the data displayed is NOT at the selected time. For example, if at 9am you see 30-minute prediction, the maps shows the prediction for 9.30am.
Configure visualisation
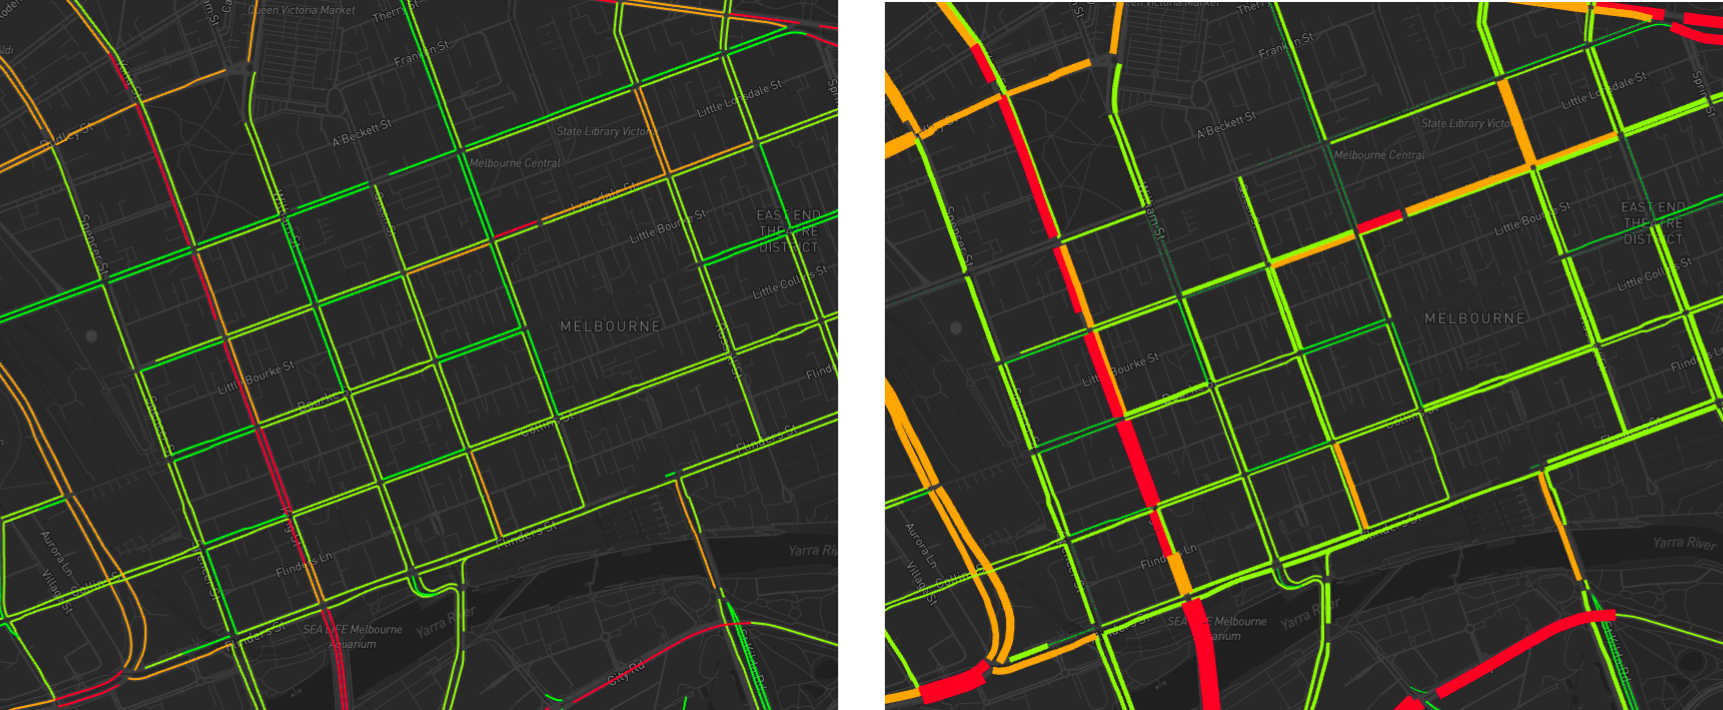
There is an option to represent the value in width. If you enable this option, links with higher value will have a thicker line than the rest. This is especially useful when you zoom out the map and see a bigger picture.
The left image shows the map without this option enabled, while the right image shows the map with this option enabled.
Configure binning
The layer comes with a default binning partition of 20, 60, and 80.
You can change this default binning by using the "Configure binning" tool. When you click on the button, a text field will appear.
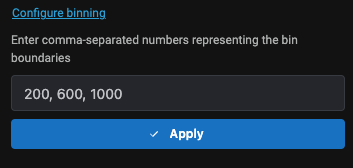
Enter a comma-separated string representing the binning boundaries. For example, if you want to group the values into these bins:
- 0 - 29
- 30 - 59
- 60 and above
Then you should enter this binning boundaries:
30, 60
Note that 0 is not included in the string.