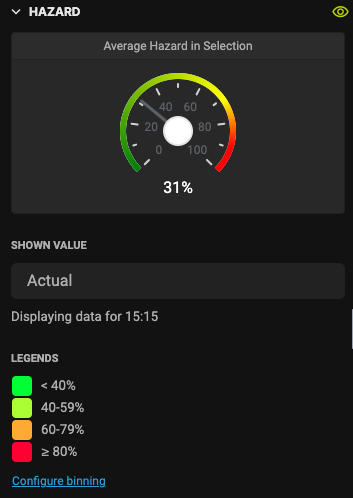
Hazard
Region availability: Melbourne, Metropolitan Melbourne
This layer visualises the estmated hazard percentage for each Link in the network. You can choose to view the estimated hazard based on actual speed and volume values at the selected time, or any predictions up to 3 hours ahead.
Configure shown value
Use the "Shown Value" selector to select which data you want to see. "Actual" means the estimated hazard index shown at the selected time. "15-minute prediction" means the predicted hazard index 15 minutes ahead since the selected time.
Below the selector, there is a text that shows you which time is shown on the map.
When you select a prediction, the data displayed is NOT at the selected time. For example, if at 9am you see 30-minute prediction, the maps shows the prediction for 9.30am.
Configure binning
The layer comes with a default binning partition of 40, 60, and 80.
You can change this default binning by using the "Configure binning" tool. When you click on the button, a text field will appear.
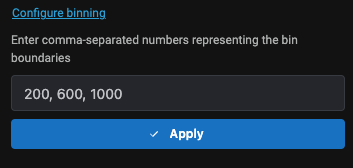
Enter a comma-separated string representing the binning boundaries. For example, if you want to group the values into these bins:
- 0 - 29
- 30 - 59
- 60 and above
Then you should enter this binning boundaries:
30, 60
Note that 0 is not included in the string.