Viewing Metrics
Metrics are statistics about the road network in the selected Region. This can include the average speed, congestion, hazard, or emission of the entire road network or a polygon.
Plotting metrics
Currently, only line chart is supported for Metrics.
First, navigate to the Metrics page using the Navbar. On the left, you will see some configuration options.
Step 1 - Selecting coverage
You can choose to plot for the entire road network, or a subset of it.
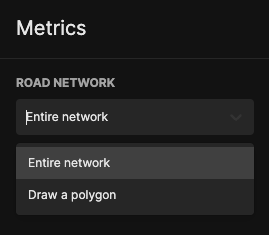
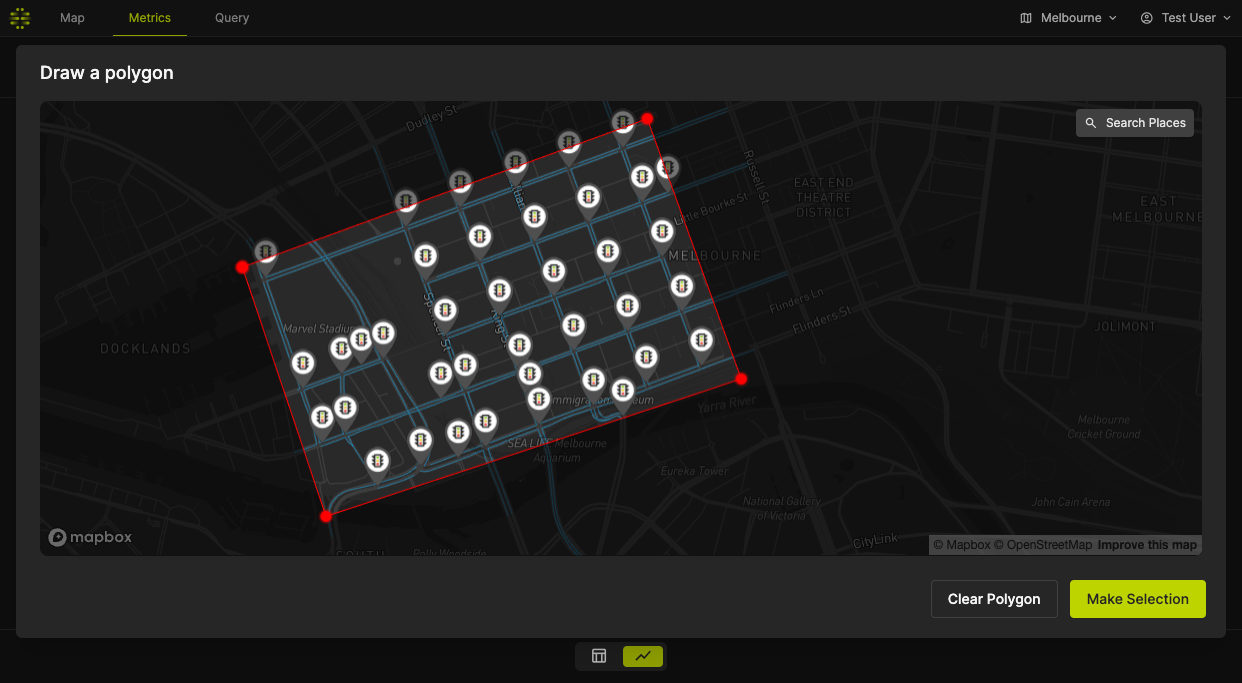
If you select "Draw a polygon", a popup will appear that allows you to draw the polygon.
You can use the "Search Places" button to fly to a particular location.
Click on the map to draw the points. Then, close the polygon by clicking on the first point that you have placed.
Once the polygon is closed, click on Make Selection to make the selection, or Clear Polygon to clear the polygon.
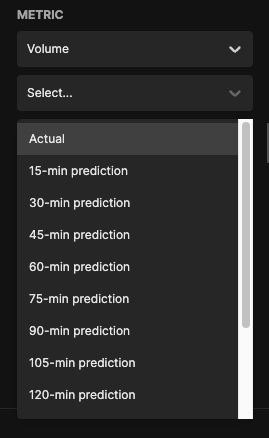
Step 2 - Selecting metric
Open the Metric selector - you will see a list of metrics available to you in the selected region. Then, select one metric to display.
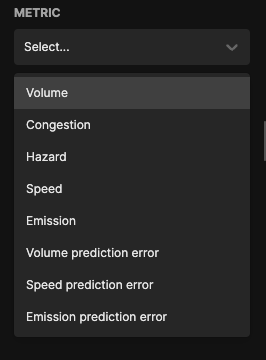
Some metrics will have what we call a subclass. Select the appropriate subclass.
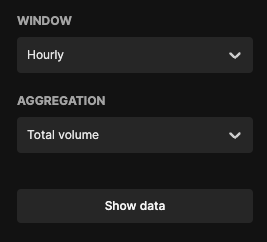
Step 3 - Configuring windowing and aggregation
Finally, select the appropriate time window and aggregation function. Then, click on "Show data" to apply the settings.
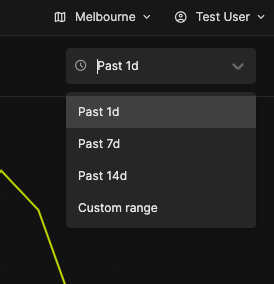
Adjusting the timeframe
On the top right, there is a timeframe picker. Select one of the preset time period, or enter a custom time range.