Dashboard Overview
Here's what you will see when first opening the dashboard.
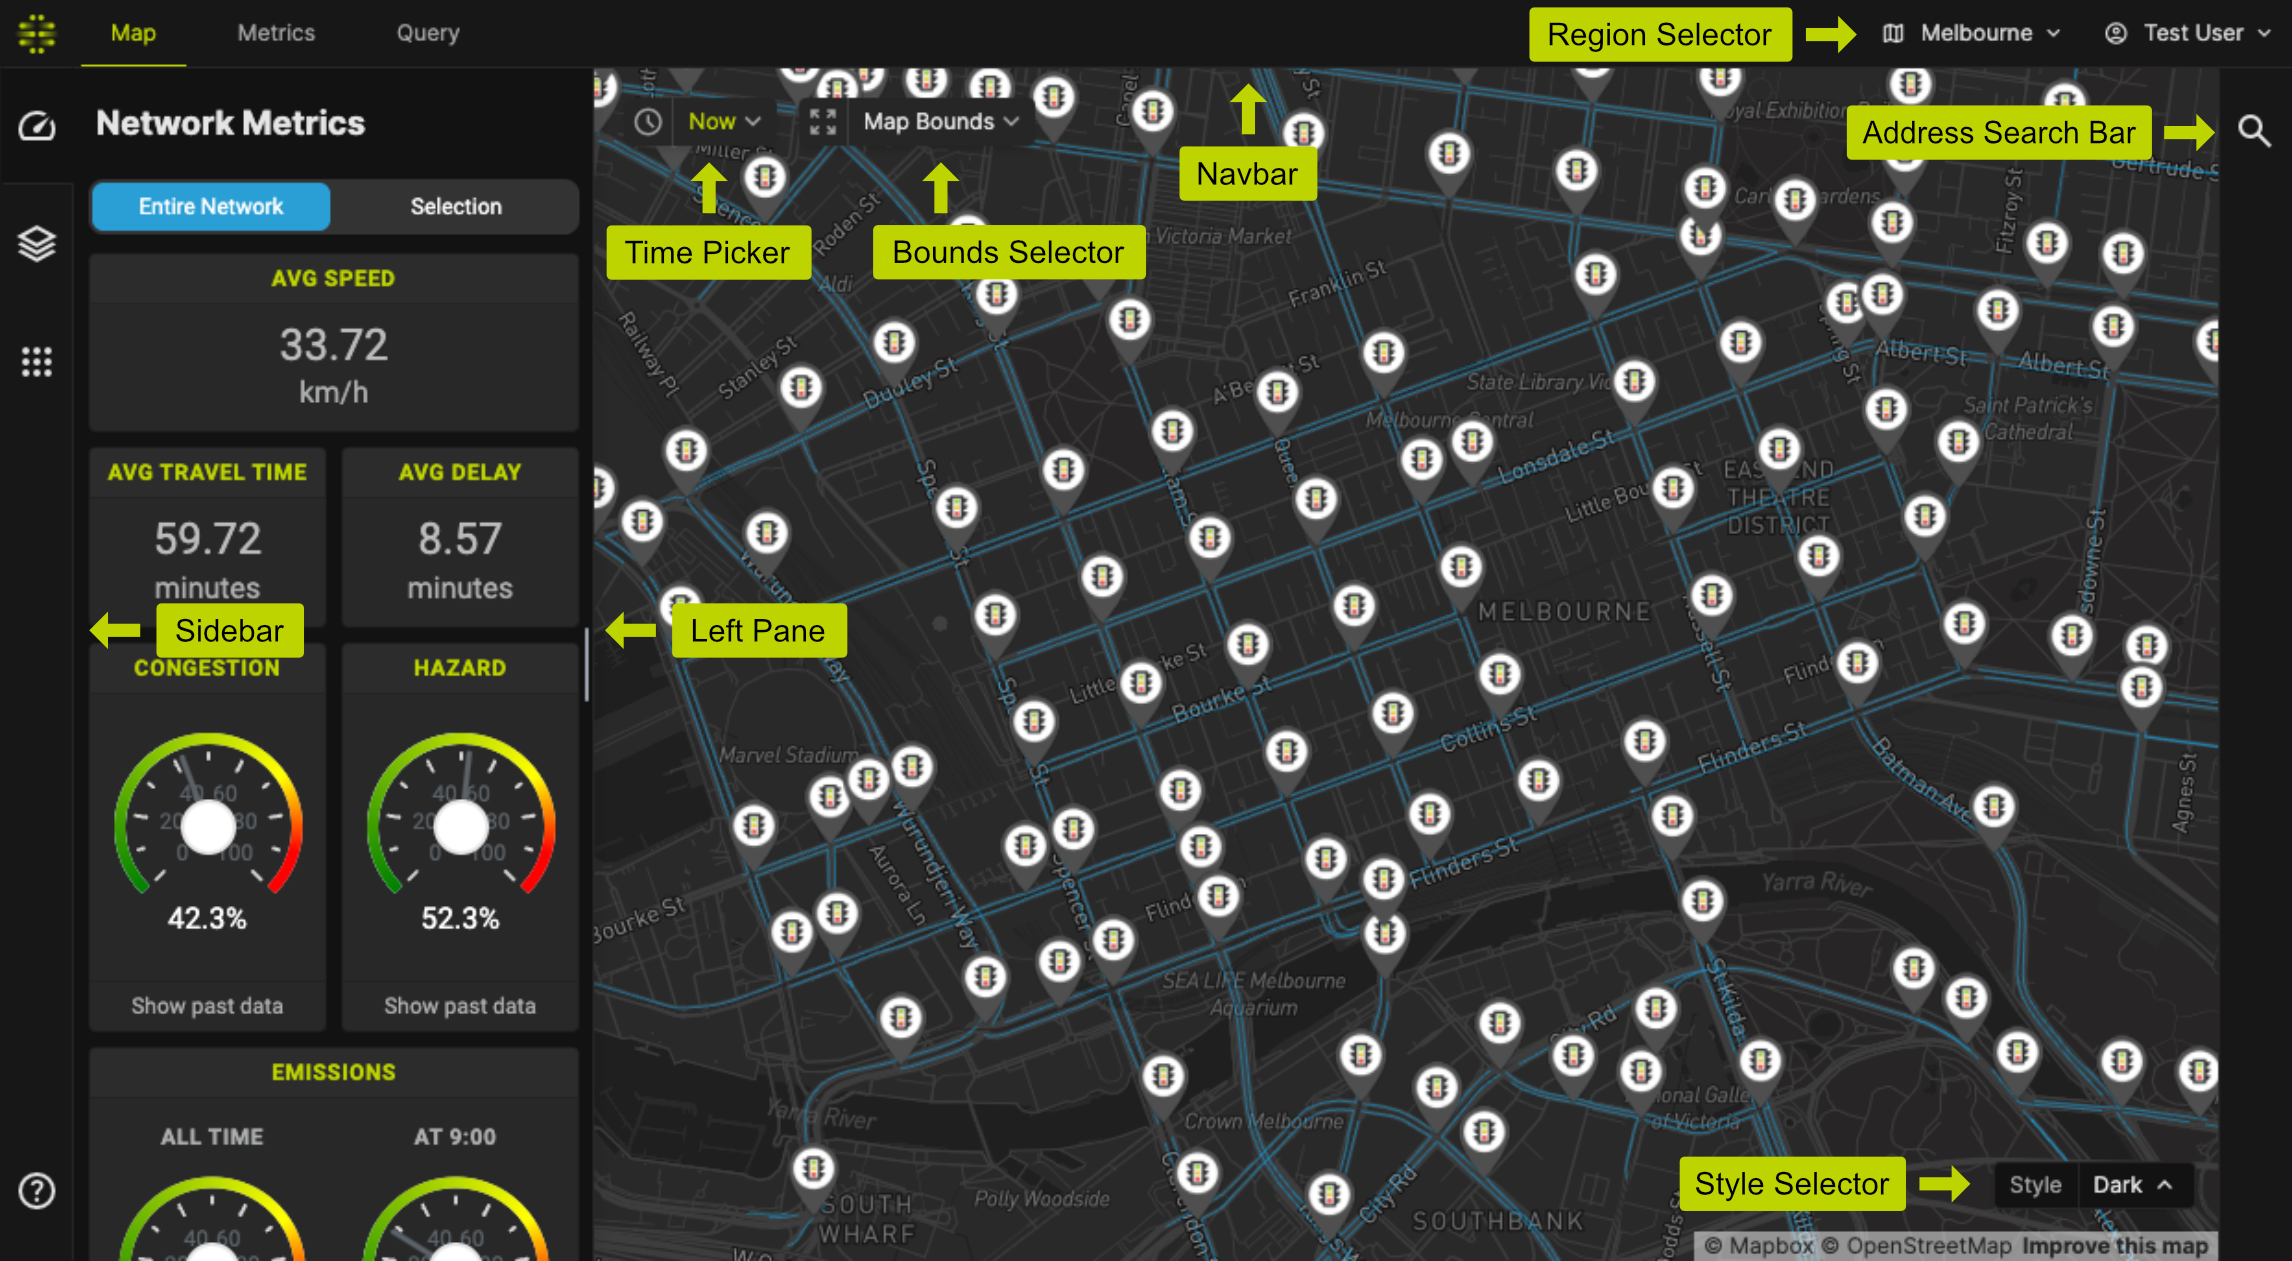
Components
Navbar
You can use the top navbar to navigate to different main features of the platform.
- Map - Allows you to visualise and interact with the map. See Map View.
- Metrics - Allows you to plot a time series plot of certain metrics of the entire road network.
- Query - Allows you to build custom query and export the data as CSV.
Time Picker
Use the time picker to change the selected time. All metrics and visualisations will be shown according to this selected time.
Bounds Selector
You can choose one of the following options:
- Map Bounds: All visible elements of the current map view.
- Polygon: Draw an arbitrary polygon.
Sidebar
Use the Sidebar to navigate across different functionalities of the Map View.
Address Search Bar
You can use this tool to jump to any location on the map. You can choose to jump to an address, a specific Link ID, or a specific Intersection ID.
Style Selector
You can use this to change the map style. The options are: Dark, Navigation, Satellite, and Streets.
Switching region
Use the Region Selector on the top right corner to change the Road Network Region.