Traffic Volume
Volume represents the total number of vehicles exiting a Link within a period of time. Actual volume data is obtained from vehicle counter inductive loops installed in most signalised intersections, placed at the end of every Link.
Note that if a Link has more than one lane, the volume represents the total volume across all lanes.
Units of measurement
We define volume as the number of vehicles per unit time. In our platform, we use three different measurements of volume.
15-minute volume
15-minute volume is measured in the number of vehicles per 15 minute. This represents the actual sum of counted traffic within a 15-minute period.
1-hour volume
1-hour volume is measured in the number of vehicles per hour (vehicles/hr). This represents the actual sum of counted traffic within a 60-minute period.
Hourly volume
Hourly volume is measured in the number of vehicles per hour (vehicles/hr).
Unlike 1-hour volume that represents the actual sum of vehicle counts within an hour, we use the term hourly volume to represent any volume data that is normalised to 1 hour. For example, we can normalise 15-minute volume to hourly volume by simply multiplying it by 4.
Volume calculation
Not all intersections are created equal. Some will have one detector per lane, some other will only have one detector per road.
This section will elaborate how we calculate volumes for each Link on different types of detector layout.
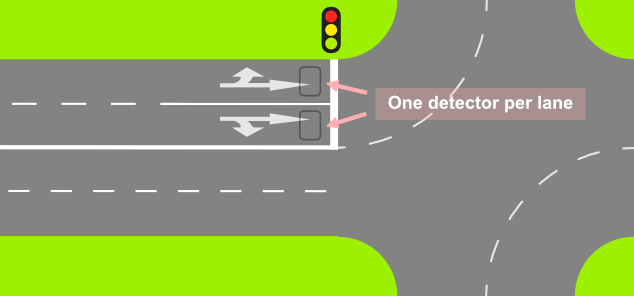
One detector per lane
Here, each lane will have its own detector, as seen in the below illustration. Link volume is calculated simply by summing the vehicle counts of detectors of all lanes.
where is the number of detectors assigned to that Link.
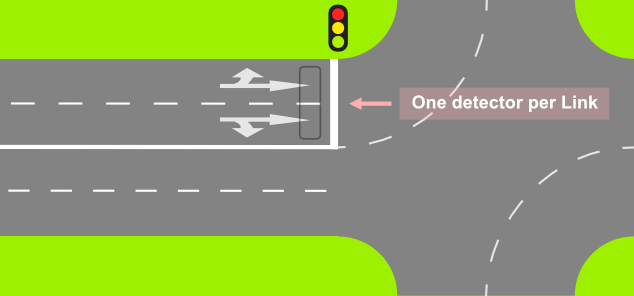
One detector per Link
Here, a Link will only have one detector. In which case, the Link volume will be equal to that detector's value.
Multiple detectors shared across multiple Links
In a more complex layout, multiple detectors can be shared across multiple Links. Here, we also use weighted averaging based on the number of lanes of each Link. This image illustrates such instance:
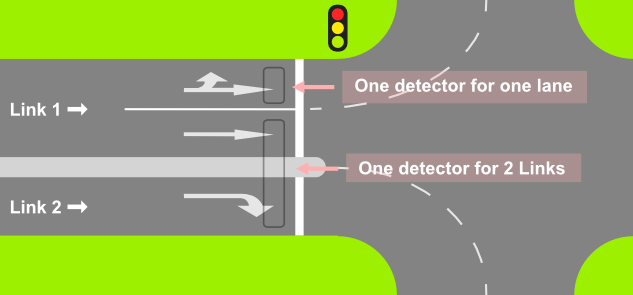
Observe that there are two detectors, one of which is shared by two Links, and the other one is assigned only to Link 1.
We use the following formula to compute the volume of each Link:
where:
- is the number of detectors attached to Link
- is the total number of lanes of all Links attached to detector , formally: where is the number of Links attached to detector .
Limitation
We only have the association between detectors and Links, not individual lanes. Therefore, occasionally the weighted averaging may not accurately represent the actual volume.
Consider the above example, where we have this setup:
- Detector 1 - connected to Link 1 (2 lanes).
- Detector 2 - connected to Link 1 (2 lanes) and Link 2 (1 lane).
The count of Detector 1 will be fully assigned to Link 1 - there's no problem there.
The count of Detector 2 will be distributed among the two Links. Looking at the detector layout, the detector count should be equally distributed to Links 1 and 2, because the Detector 2 counts one lane in Link 1 and one lane in Link 2.
However, because Link 1 has two lanes and Link 2 only has one, Link 1 will have 2/3 of the detector count. As a result, Link 1 will have more volume than it should, and Link 2 will have less.