Definition of Terms
This contains some definition of terms that we use in the AIMES Ecosystem platform.
Road Network Region
A Road Network Region (also referred to as Region) is an interconnected collection of Links, Intersections, and other entities such as emission detector and public transport routes.
One Region is isolated from another, i.e. there are no entities connected between two Regions.
Intersection
An Intersection is a place where two or more Links meet. It could be a junction that connects more than two roads in different directions, or a signalised pedestrian crossing.
Typically, an Intersection has a traffic signal. On some Regions, an Intersection is associated with SCATS vehicle counters to count traffic volume.
Link/Road
A Link (also known as Road) is a stretch of road that connects two Intersections.
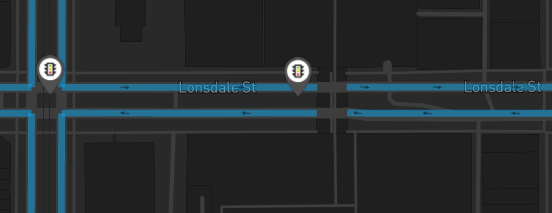
Because an Intersection can be a signalised pedestrian crossing, a Link may not stretch an entire block. Observe the following example at Lonsdale Street, Melbourne, where the stretch of road is divided into 2 different Links, separated by a signalised pedestrian crossing.
Panorama
Panorama is a 360-degree panoramic photo of an Intersection.
Volume
Volume represents the number of vehicles exiting a Link within a period of time. Actual volume data is obtained from vehicle counter inductive loops installed in signalised intersections, placed at the end of every Link.
Volume per Link is the total number of vehicles passing through all detectors assigned to that Link.
More on Volume on this page: Traffic Volume
Speed
Speed is measured in km/h. It is obtained from TomTom Intermediate Traffic API.
In this system, we assign one speed value to an entire Link, regardless of how long it is. However, TomTom splits the speed data into segments, each having different length and average speed value. Therefore, we normalised the average speed using the following method:
First, we map each segment into a corresponding Link. One Link can be mapped into more one or more segments. Then, we compute the average speed weighted by the segment length:
where is the number of segments mapped to a particular Link.
Hazard
Hazard score estimates the probability of an accident happening on a particular Link in the long run (i.e., about 7 years). It is measured in percentage (%).
Congestion
Congestion score is measured in percentage (%), where 0 indicates no traffic, and 100% indicates that the road is at full capacity. It is calculated using this formula:
where is the hourly volume of the Link, is the maximum number of vehicles per hour per lane, and is the number of lanes.
Emission
Emission is measured in PM2.5µg/m3, which denotes the mass of PM2.5 particles within a cubic metre volume. Actual emission data is retrieved from environmental protection authorities.
Link Predicted Emission
The emission data coming from EPA is measured from a set of fixed observstion stations placed across the region. To have a prediction of emission emitted by each Link, we use the following method:
First, we trained a prediction model that takes the PM2.5 reading and the speed and volume of the nearest Link, and outputs the next PM2.5 readings for the next 3 hours. Then, we used the trained model to predict PM2.5 emission for all Links, based on the speed and volume of the Link.
Average travel time
Average travel time is measured in minutes, which estimates the average travel time of riders in a region (or a subset of it). It is calculated using this method:
First, we use all-pairs shortest path algorithm to compute the shortest path between all pairs of intersections in the network. The path weight is based on the straight-line Haversine distance between two ends of each Link.
Second, we take the longest pairwise path distance, and get the speed of each Link in the path. If the speed data is missing, we use the speed limit instead.
Finally, we compute the travel time using this equation:
where is the number of Links in the shortest path, denotes the length of -th Link (in metres), and denotes the average speed of the -th Link (in km/h).
Expected travel time
Expected travel time has similar formula as Average Travel Time, but instead of using actual speed data we use the speed limit. The idea is that people tend to travel near the speed limit, and this metric will represent the expected travel time if there is no traffic congestion.
where is the number of Links in the shortest path, denotes the length of -th Link (in metres), and denotes the speed limit of the -th Link (in km/h).
Average delay
Average delay is the difference between Average Travel Time and Expected Travel Time:
Cycle time
We define cycle time as the average duration of all phases within a 15-minute time period. It is an approximation of the actual cycle time based on real-time signal data, but it is usually shorter than the actual cycle time. Because SCATS can adapt the timing on each phase on the fly, cycle time can change over time.
Cycle time is measured in seconds.
Estimated queue length
Estimated queue length is measured in metres. Queue length is estimated from our internal engine.